Michael's Projects
a place to share some of my work that is not under NDA
NOTE: None are complete in the sense of released, reviewed, iterated, and finalized, but each demonstrates a bit of my skill and style. Most of these were just fun projects but a few had real world usage. If you have a project in mind that you would like me to iterate on, let me know at michael@theatherlys.com (see PPT slides)
In Progress...
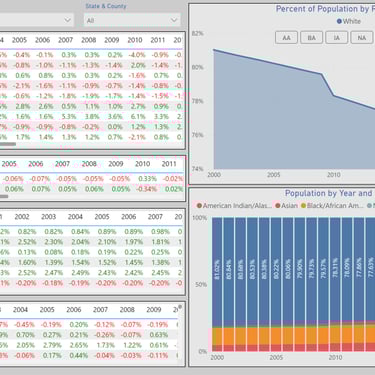
Race in America

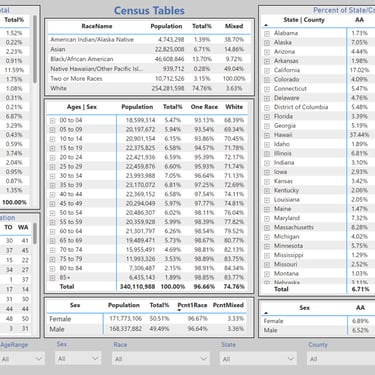
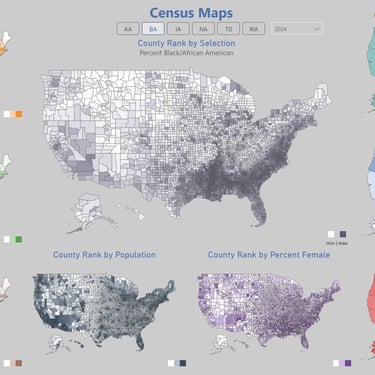
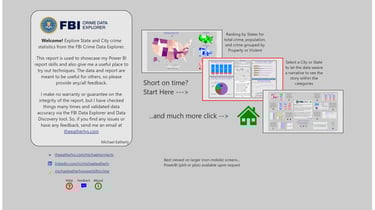
FBI Crime Data (PowerBI)
or MichaelEatherlyPowerBI_FBICrime if above fails
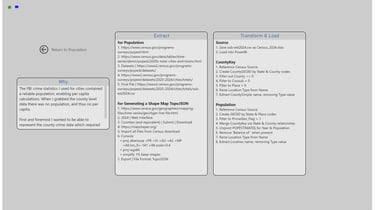
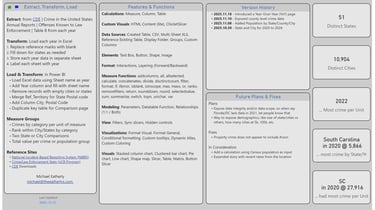
This report is used to showcase my Power BI report skills and also give me a useful place to try out techniques. The data and report are meant to be useful for others, so please provide any/all feedback
I make no warranty or guarantee on the integrity of the report, but I have checked things many times and validated data accuracy via the FBI Data Explorer and Data Discovery tool. So, if you find any issues or have any feedback, send me an email at theeatherlys.com

VAERS (PowerBI)
Can data be dangerous? It can be if you interpret it wrong...
VAERS is a passive reporting system, meaning it relies on individuals to send in reports of their experiences to CDC and FDA. VAERS is not designed to determine if a vaccine caused a health problem, but is especially useful for detecting unusual or unexpected patterns of adverse event reporting that might indicate a possible safety problem with a vaccine. This way, VAERS can provide CDC and FDA with valuable information that additional work and evaluation is necessary to further assess a possible safety concern.


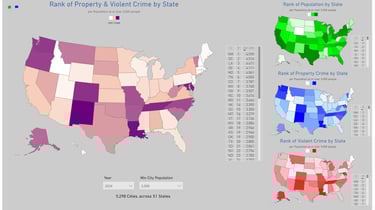
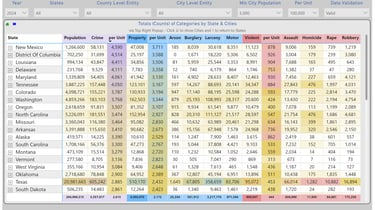
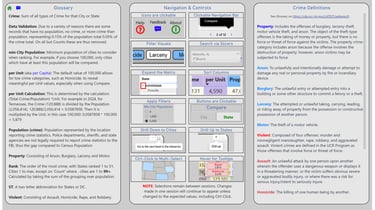
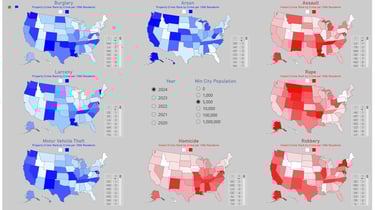
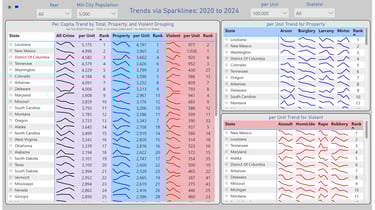
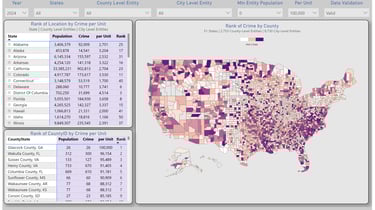
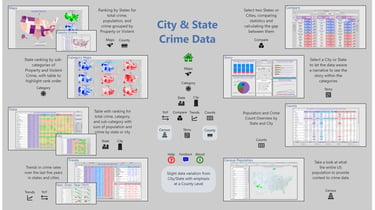
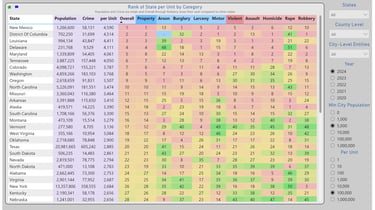
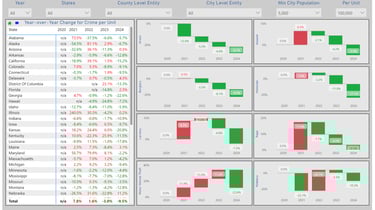
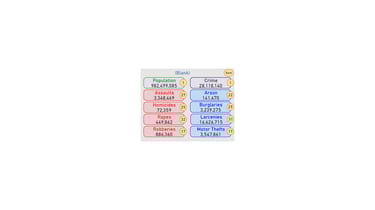
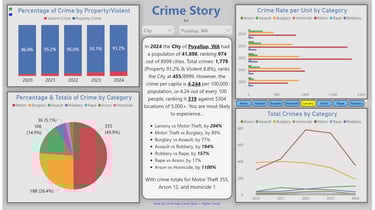
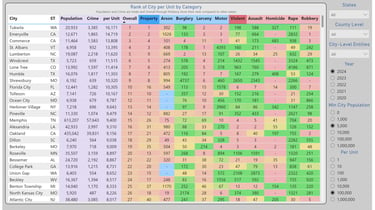
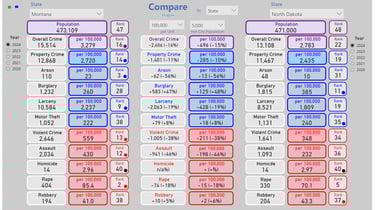
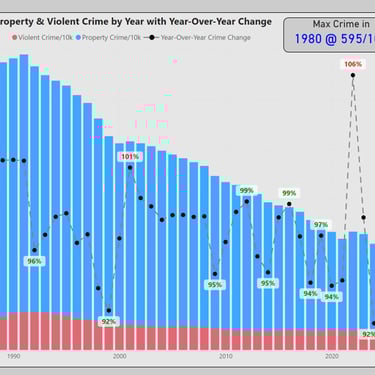
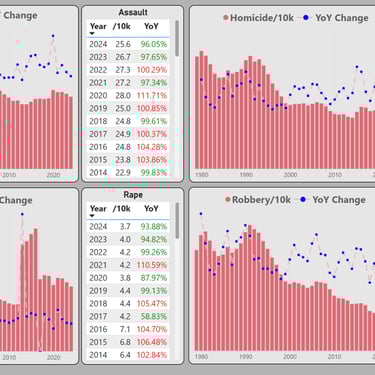
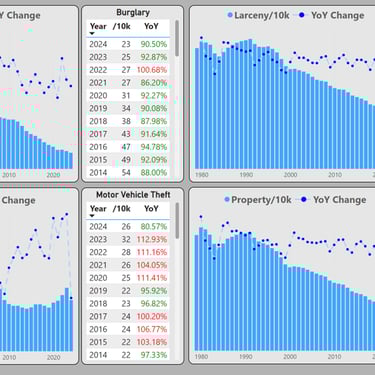
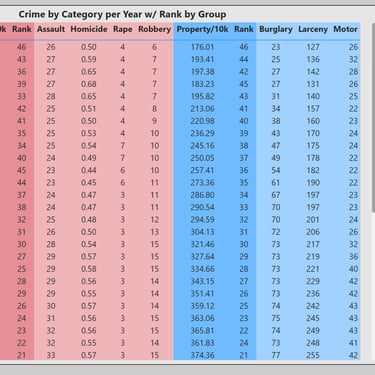
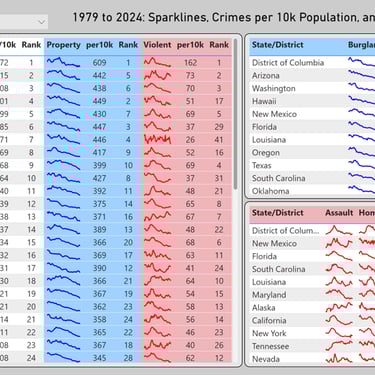
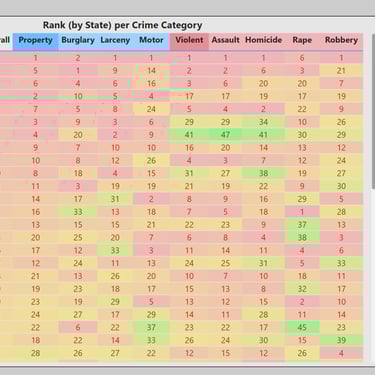
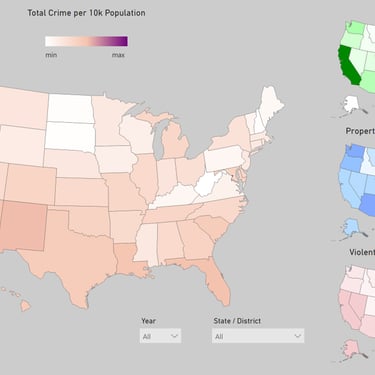
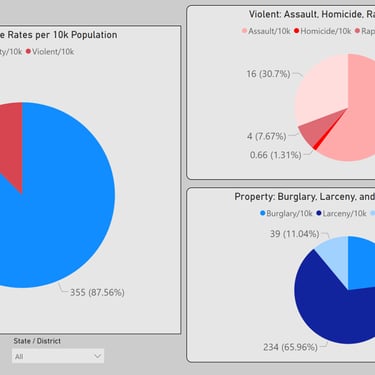
FBI National Crime Statistics (PowerBI)
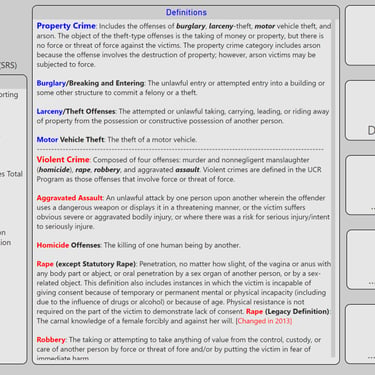
Sometimes we hear some 'data' and are curious if it matches what the data says. Although this is not a direct match to the data statement since that was at a city level, this report exposes the trending for crime statistics by state across both property and violent crime.
See for yourself if we/you are safer now than we/you used to be...
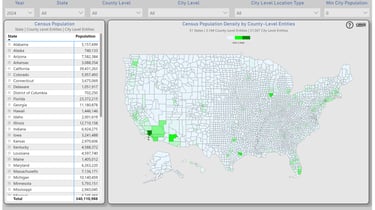
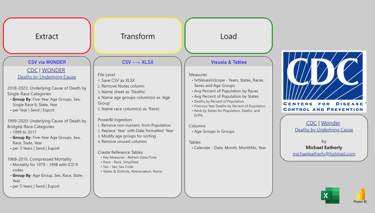
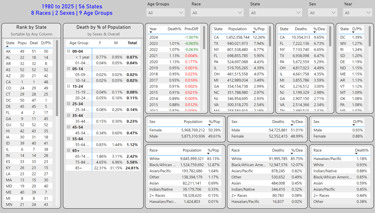
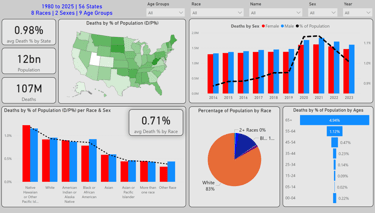
CDC Deaths (CDC | Wonder)
Using CDC data to represent death rates by year, state, sex, race, and age.
Extract: Deaths by Underlying Cause
Transform: File Level via XLSX
Load: Years, States, Races, Sexes, and Age Group
PBIT/X and data available upon request
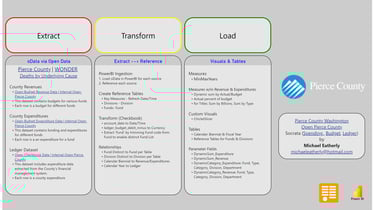
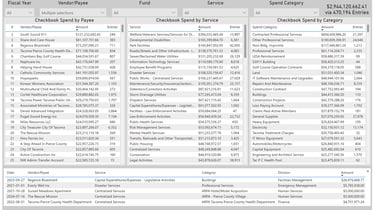
Pierce County Open (PBIT available upon request)
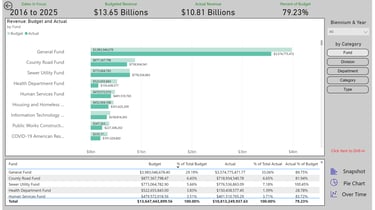
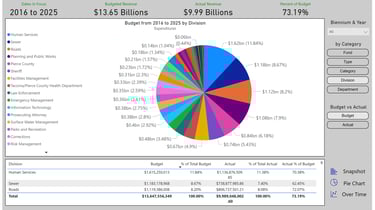
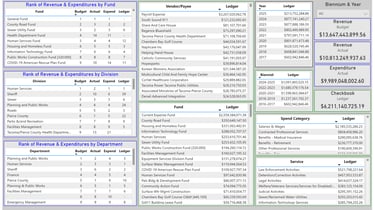
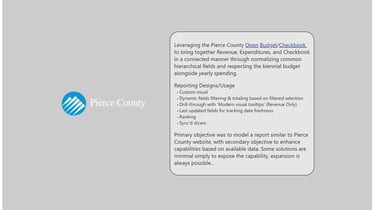
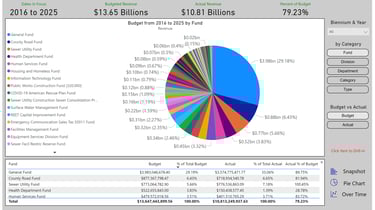
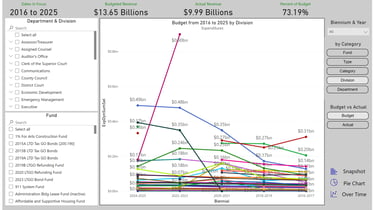
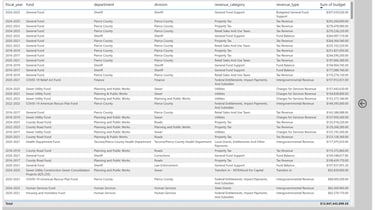
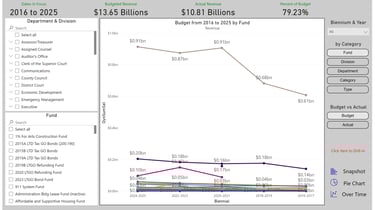
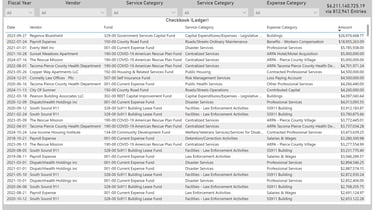
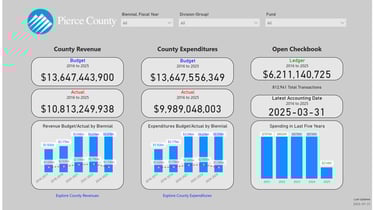
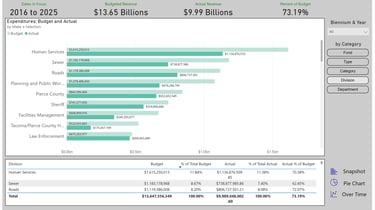
Leveraging the Pierce County Open Budget / Checkbook to bring together Revenue, Expenditures, and Checkbook in a connected manner by normalizing common hierarchical fields and respecting the biennial budget alongside yearly spending.
Reporting Designs/Usage
Custom visual
Dynamic fields filtering & totaling based on filtered selection
Drill-through with 'Modern visual tooltips' (Revenue Only)
Last updated fields for tracking data freshness
Ranking
Sync'd slicers
Primary objective was to model a report similar to Pierce County website, with secondary objective to enhance capabilities based on available data. Some solutions are minimal simply to expose the capability, but expansion is always possible...
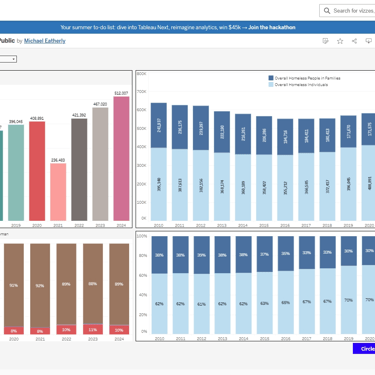
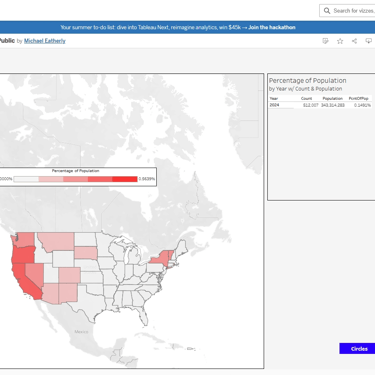
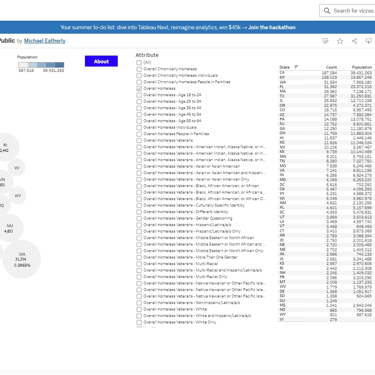
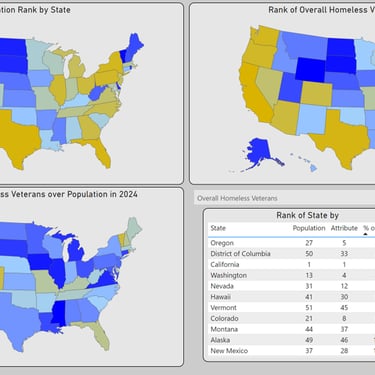
Homelessness in America (files available upon request)
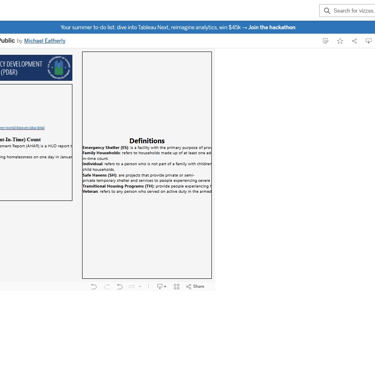
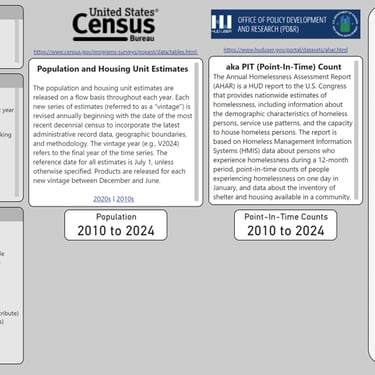
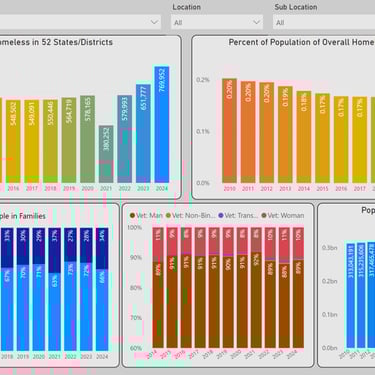
Leveraging the Annual Homelessness Assessment Report (AHAR) data from HUD via AHAR Reports | HUD USER I combined the years into a normalized dataset that enables filtering by State and Area with grouping of Overall, Individuals, or People w/ Families.
The Annual Homelessness Assessment Report (AHAR) is a HUD report to the U.S. Congress that provides nationwide estimates of homelessness, including information about the demographic characteristics of homeless persons, service use patterns, and the capacity to house homeless persons. The report is based on Homeless Management Information Systems (HMIS) data about persons who experience homelessness during a 12-month period, point-in-time counts of people experiencing homelessness on one day in January, and data about the inventory of shelter and housing available in a community.
<-- Tableau
PowerBI -->

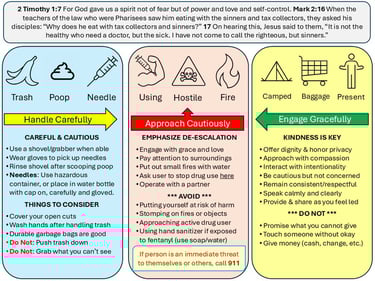
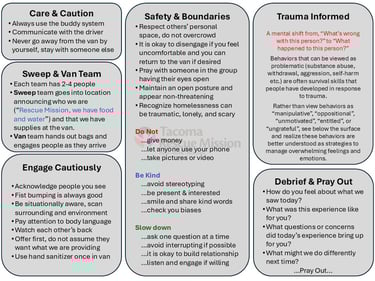
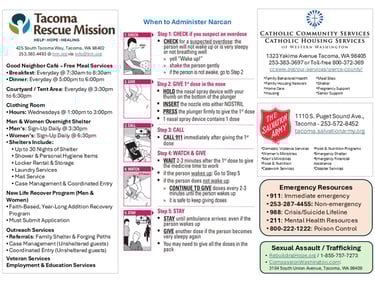
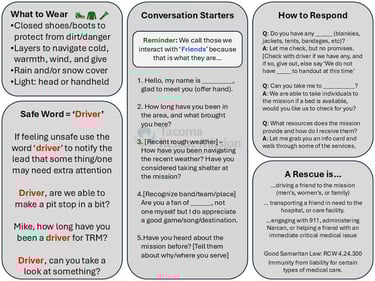
Community Outreach: Quick Guides
Handouts designed to be a printed front/back on standard paper to guide a faith-based community how to engage with our street friends.
Slides available upon request
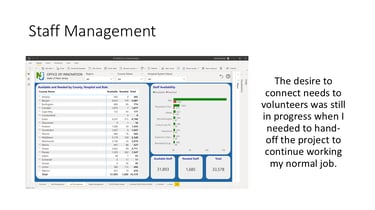
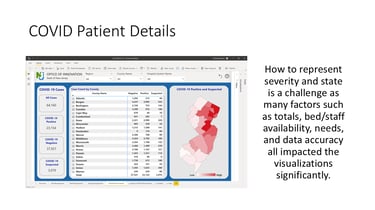
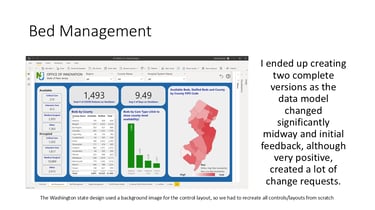
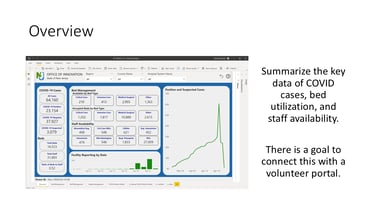
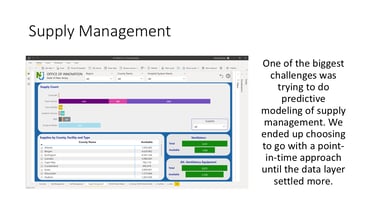
State of NJ Emergency Response
“Michael has volunteered to participate in our COVID-19 mobilization in support Microsoft’s response to the global coronavirus outbreak.”
I was asked to create a PowerBI using a dataset provided by New Jersey related to COVID-19